These industries employ the most immigrants
Professional and administrative services employ the most immigrants in the United States, while agriculture and construction have the highest share. Here is the sector and industry breakdown, and where graduates on F-1, OPT or J-1 will find the most company.
Professional, scientific and administrative services employ the most immigrants in the United States: 4.5 million of the 30.8 million foreign-born workers in 2024. Agriculture and construction have the highest share, with more than one worker in four born abroad. If you are an international student or early-career worker, the list that matters to you is a different one, and I sort out which below.
Who counts as an immigrant here
The count uses foreign-born: anyone who lives in the United States and was born outside it, whether they are now a citizen, a green card holder, a student, a temporary worker or undocumented. The Bureau of Labor Statistics uses the same definition, including temporary residents such as students, and notes that its survey does not separately identify those groups. So you are counted on F-1, OPT or J-1, but foreign-born is not a visa status.
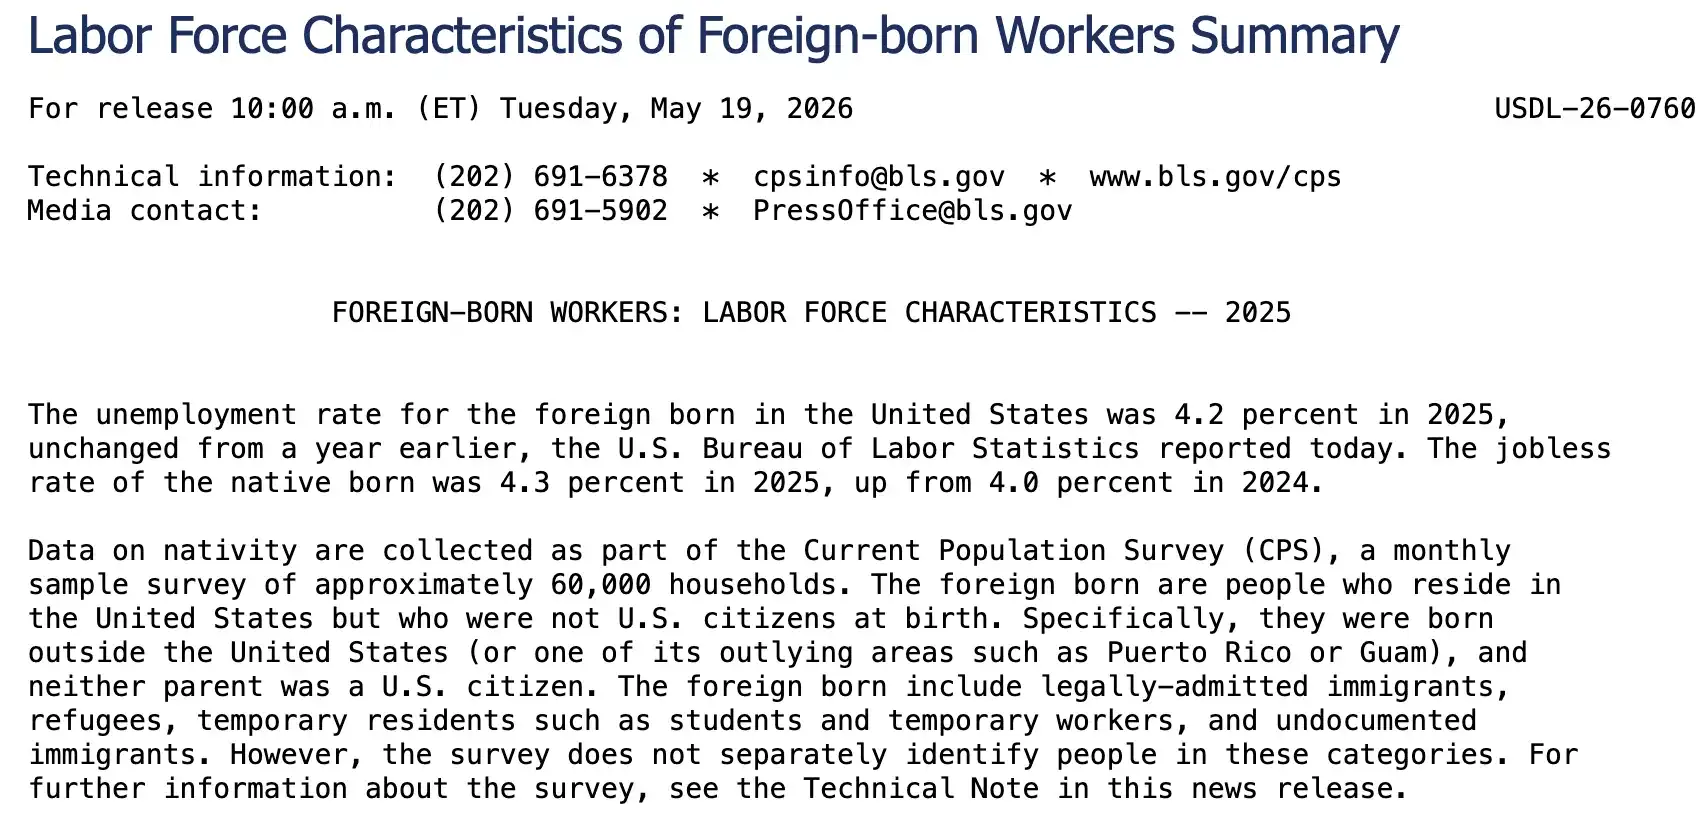
In the Census Bureau’s 2024 data, 30.8 million of 167.4 million employed civilians were foreign-born, or 18.4 percent. About 14.9 million of them were not U.S. citizens, and the rest had naturalized. The Bureau of Labor Statistics reads 19.1 percent for 2025, so close to one worker in five is the safe summary. The two sources agree.
| Source | Year | Base | Foreign-born share |
|---|---|---|---|
| Census Bureau, American Community Survey | 2024 | Employed civilians aged 16 and over | 18.4% |
| Bureau of Labor Statistics, Current Population Survey | 2025 | Civilian labor force | 19.1% |
The 2025 figure averages 11 months, because the federal shutdown stopped the October survey. In that year the foreign-born unemployment rate was 4.2 percent against 4.3 percent for the native born, and median weekly earnings for full-time foreign-born workers were $1,059 against $1,236.
Where the headcount is highest
Professional, scientific and administrative services lead with 4.5 million foreign-born workers. Health care follows with 3.4 million, manufacturing with 3.2 million and construction with 3.1 million, then arts, entertainment, lodging and food with 2.9 million and retail with 2.7 million.
- Professional, scientific and administrative4.55
- Health care3.41
- Manufacturing3.21
- Construction3.06
- Arts, entertainment, lodging and food2.93
- Retail trade2.71
- Education2.16
- Transportation and warehousing1.96
- Finance, insurance and real estate1.7
- Other services1.68
U.S. Census Bureau, ACS 2024 1-year PUMS, employed civilians 16 and over, October 15, 2026. Counts of foreign-born workers per sector (millions); refreshed on a schedule.
Headcount mostly follows sector size. Retail and health care rank high even though immigrants are a smaller share of their workers than average. The next ranking corrects for that.
Where immigrants are the biggest share
Agriculture is 26.7 percent foreign-born and construction 26.4 percent, against 18.4 percent across all industries. Transportation and warehousing follows at 23.2 percent, and other services reaches 21.0 percent. Public administration (10.7 percent) and utilities (10.0 percent) sit far below the average. The sectors at the top of the share ranking are not the ones at the top of the headcount ranking. You need both views.
- Agriculture26.7
- Construction26.4
- Transportation and warehousing23.2
- Professional, scientific and administrative21.1
- Other services21
- Manufacturing19.9
- Arts, entertainment, lodging and food19.7
- Wholesale trade19.1
- Social assistance19
- Health care17
- Information16.5
- Finance, insurance and real estate15.5
- Retail trade15.3
- Education13.5
- Mining and extraction13.2
- Public administration10.7
- Utilities10
U.S. Census Bureau, ACS 2024 1-year PUMS, employed civilians 16 and over, October 15, 2026. Counts of foreign-born workers per sector (percent); refreshed on a schedule.
Zoom in and it sharpens. In taxi and limousine service, 55.7 percent of workers are foreign-born, and nail salons, building cleaning, private households and landscaping all fall between 36 and 44 percent. The number after the plus-minus sign is the margin of error.
| Industry | Foreign-born share | Foreign-born workers | With a bachelor’s degree or higher |
|---|---|---|---|
| Taxi and limousine service | 55.7% ±1.7 | 318,000 | 26.8% |
| Nail salons and other personal care | 43.7% ±1.5 | 263,000 | 14.1% |
| Services to buildings and dwellings | 41.9% ±0.8 | 731,000 | 9.6% |
| Private households | 41.8% ±1.6 | 255,000 | 14.7% |
| Landscaping | 36.0% ±1.1 | 466,000 | 5.0% |
| Animal slaughtering and processing | 35.7% ±1.7 | 156,000 | 7.5% |
| Semiconductors and electronic components | 34.7% ±1.3 | 244,000 | 69.1% |
| Traveler accommodation | 34.0% ±1.1 | 439,000 | 21.1% |
| Crop production | 32.6% ±1.0 | 358,000 | 6.4% |
| Computer systems design | 26.8% ±0.5 | 1,085,000 | 88.0% |
The last column splits the list. Most of these industries employ few degree holders, but semiconductors and computer systems design employ many, and those two are the graduate-heavy rows.
Where degree holders work
Across the economy, 39.0 percent of foreign-born workers hold a bachelor’s degree or higher. That share runs from 88.0 percent in computer systems design to 5.0 percent in landscaping, so the industries with the most immigrants and the industries that employ immigrant graduates are largely different lists. Which one are you on? If you hold a degree, I would start with the graduate list.
| Industry | Foreign-born workers | Share of the industry’s workers | With a bachelor’s degree or higher |
|---|---|---|---|
| Computer systems design | 1,085,000 | 26.8% | 88.0% |
| Colleges and universities | 911,000 | 19.1% | 81.3% |
| Hospitals | 1,374,000 | 16.9% | 63.1% |
| Elementary and secondary schools | 1,091,000 | 10.7% | 58.0% |
| Food services and drinking places | 1,999,000 | 20.9% | 13.7% |
| Construction | 3,061,000 | 26.4% | 11.6% |
Colleges and universities, hospitals and schools each employ over 900,000 foreign-born workers, and more than half of them hold a degree. Construction and food service employ more people, but only about one in eight has one.
What this means for your search
The data shows who works where, not who needed a visa, but the work visa route differs by employer type. The H-1B visa has an annual cap of 65,000 new statuses, plus 20,000 more petitions for people with a U.S. master’s degree or higher. Workers petitioned for or employed at a university or its affiliated nonprofits, a nonprofit research organization or a government research organization fall outside the cap. Employers outside those types file under the cap.
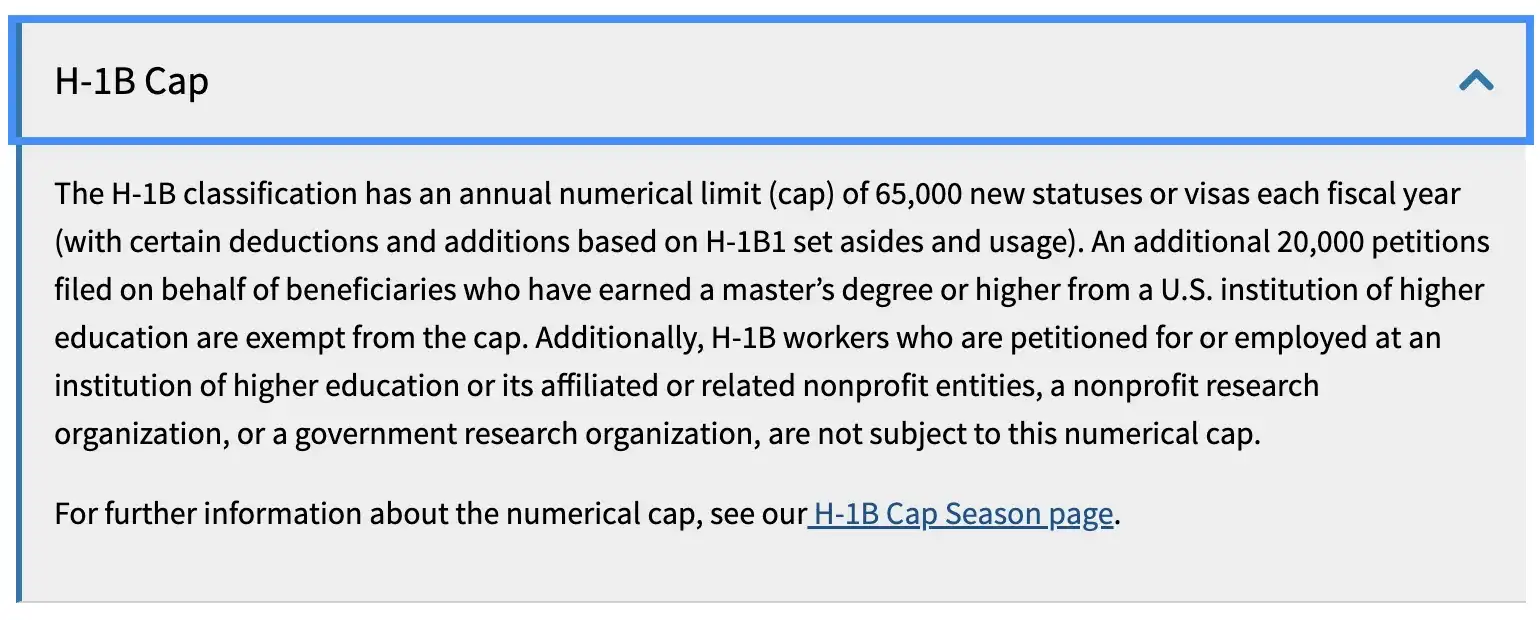
Colleges and universities are one of those employer types, and they employ 911,000 foreign-born workers, 19.1 percent of their staff. The Census industry also covers junior colleges and professional schools, so read it as the size of the field, not the count of cap-exempt jobs. The cap-exempt employers guide lists who qualifies.
- Foreign-born is not a visa status. About 14.9 million of the 30.8 million are not citizens, and that group mixes green card holders, temporary workers and undocumented people.
- A high share is a hint, not proof. It shows where immigrants are hired, so check an employer’s own record before you count on it (how to check).
- Rules change. Read the current USCIS page before you plan around a cap.
Where the numbers come from
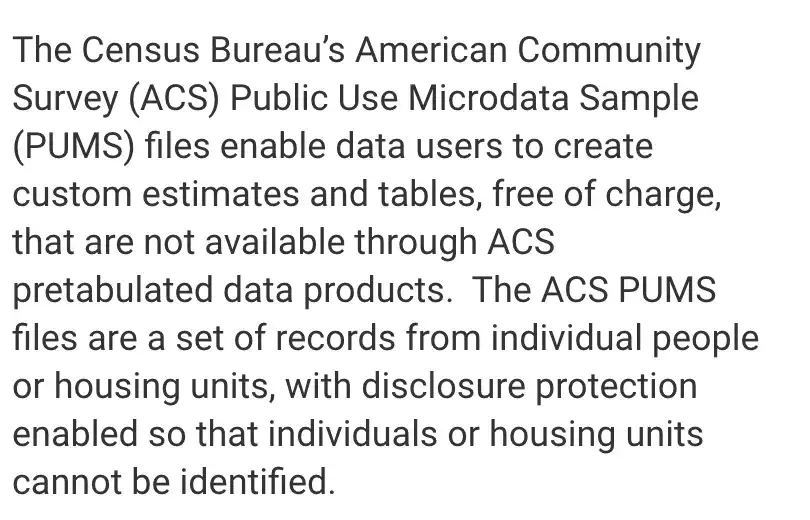
The industry counts come from the Census Bureau’s Public Use Microdata Sample, a set of individual records that anyone can tabulate for free. I used the 2024 one-year file and counted employed civilians aged 16 and over. The national 18.4 percent is accurate to within 0.1 point at 90 percent confidence, while the narrow industries above carry margins up to 1.7 points.
Verdict
Immigrants work in every sector, 30.8 million of them in 2024, with the largest headcounts in professional services, health care, manufacturing and construction and the highest shares in agriculture, construction and transportation. If you hold a degree and need a work visa, the industries where graduates concentrate, such as computer systems design, colleges and universities and hospitals, tell you more than the share ranking does.
Sources:U.S. Census Bureau - American Community Survey Public Use Microdata Sample, U.S. Census Bureau - ACS 2024 1-year PUMS files, U.S. Bureau of Labor Statistics - Foreign-born workers, labor force characteristics, 2025, USCIS - H-1B specialty occupations.
US jobs that tell you if they sponsor.
- Every posting states its visa stance
- Filter by role, visa and state
- Links to the employer's own listing
$8a month, cancel any time
See Visa JobsJoin Visa Radar on Discord
A free community for people moving to the US on a J-1, F-1/OPT or work visa.
Free when you join
- A job post every day
- Answers to your visa questions
- Wins from people on the same path
Responses
Keep reading

What no sponsorship in a job post means, and what it does not
A job post that says no sponsorship usually means no H-1B petition. It does not by itself rule out OPT, CPT or STEM OPT. Here is what each route asks of the employer.

How to find US employers open to visa holders
Sponsor lists show who filed in the past. The J-1 sponsor directory, USCIS and Department of Labor data and the posting itself each answer a different question. Here is what each can and cannot say.

Cap-exempt H-1B employers: who qualifies and what changed in 2026
Universities, their affiliated nonprofits and research organizations can file H-1B petitions outside the 65,000 cap. Here is who counts, what the 2026 fee news says about them, and which dates are still open.